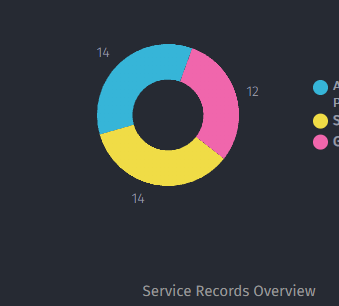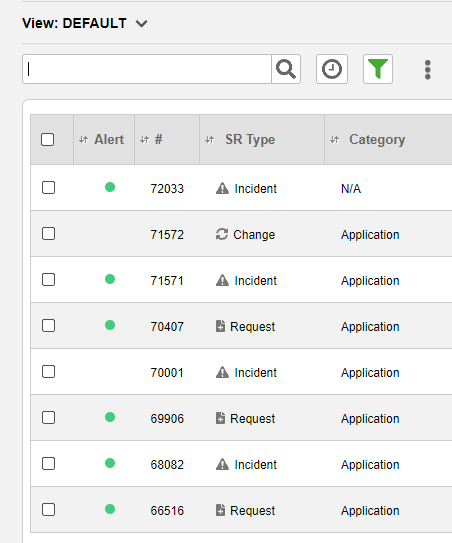

I have created a custom Dashboard for the Application Support team in our business. One of the graphs is Service Records Overview which is grouped by ‘Assigned to’. I’ve set a filter so that it only displays Assigned to=’User1’, Assigned to=’User2’ and Assigned to=’User3 (the users being names of the team in question). When clicking on ‘User1’ (cyan) to drill down into the detail, the list only returns 8 service records. All other users match perfectly.